TWO SIGMA CONNECT: RENTAL LISTING INQUIRIES
Predicting the New York Tenants interests on new rental listing with Rent Hop.com
Overview:
Rent Hop makes apartment search smarter by using data to sort rental listings by quality. Two Sigma and Rent Hop, a portfolio company of Two Sigma Ventures wanted to predict the number of inquiries a new listing receives based on the listing’s creation date and other features. Doing so will help Rent Hop better handle fraud control, identify potential listing quality issues, and allow owners and agents to better understand renters’ needs and preferences.
Data Introduction:
We will predict how popular an apartment rental listing is based on the listing content like text description, photos, number of bedrooms, price, etc. The data comes from renthop.com an apartment listing website. These apartments are located in New York City.The target variable, interest level, is defined by the number of inquiries a listing has in the duration that the listing was live on the site.
Tech-bots Predictive Solution:
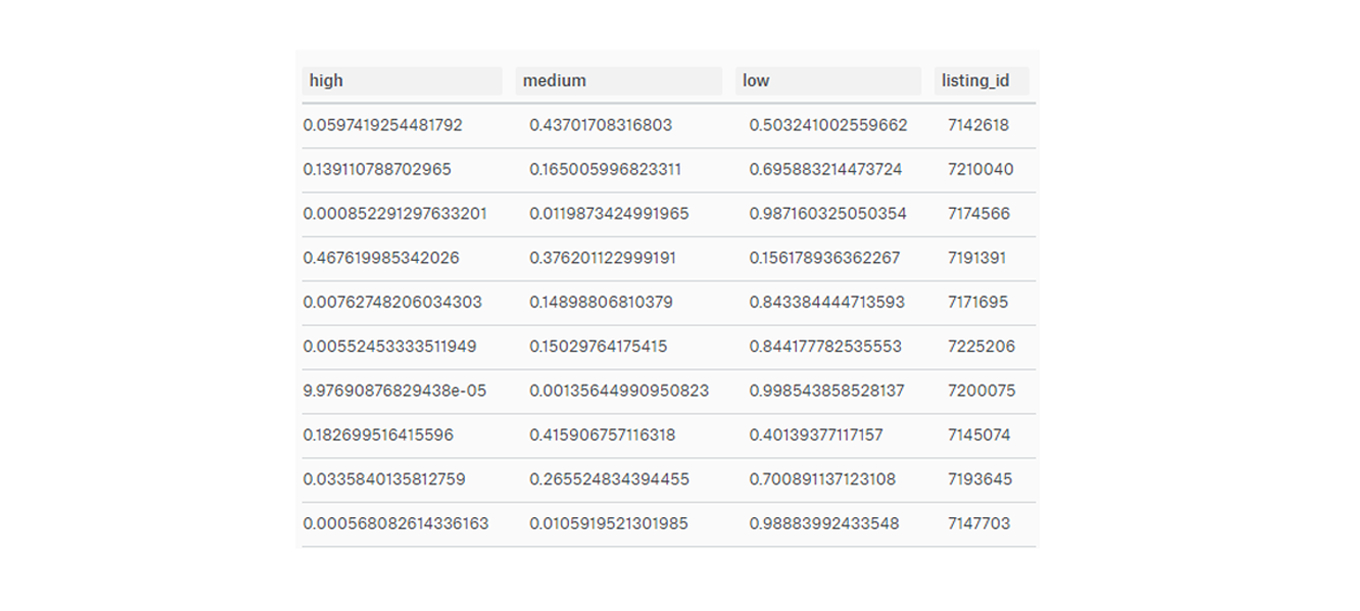
We have chosen R language for Prediction on interest level, so in our analysis we considered, Test and Train tables which are of JSON format. Train dataset is useful for our model prediction where we train our model for prediction, Here model suggests algorithm used for prediction. Test is the table where we have to find out interest level by individual fields HIGH, MEDIUM, LOW. To go further we have to consider fields which are in our Test dataset, by default both Test and Train datasets are having same fields. From the data fields section of our Train data we will look at mostly on features field which will decide the customers interest so we split the sentence in to individual words for our model convenient and for our visualization to. We use an algorithm called XGB where it is useful for performance (Running in low time) and another algorithm called Prediction for predicting our model. After having done with our XGB & Prediction algorithms it gives the predicted data based on listing id with in less time of around 0.55982 seconds. Based on listing id we are going to have our model generated which is shown below